Get insights about Power Apps usage with Microsoft Clarity PCF code component
Getting insights on user behavior in Power Apps canvas apps can be in various ways - for instance, you can analyze app telemetry with Azure Application Insights and trace events. If you are more interested in visual heatmaps and session recordings, you might already have had a look at Microsoft Clarity, which exactly provides that:
What is Microsoft Clarity and how do I connect it to a Power Apps canvas app?
Clarity is a user behavior analytics tool that helps you understand how users are interacting with a website through features such as session replays and heatmaps.
It is installed by adding a tracking code into the <head> section of the website.
As a Power Apps canvas app running in the browser is also still just a website, we only need to find a way on how to inject the Clarity JavaScript script into the head of our canvas app.
Unfortunately, there is no connector for Microsoft Clarity, but we can leverage the Power Apps component framework for that.
Power Apps component framework to the rescue
With Power Apps component framework we can create code components for Power Apps. I created a code component for Microsoft Clarity, so that we can use Clarity in our canvas apps.
High level overview
To give you an idea on how to create this, here is high level overview- it’s not meant to replace extensive learning with very detailed step-by-step instructions though. I will link to resources though if this is your first code component - it was my first :-)
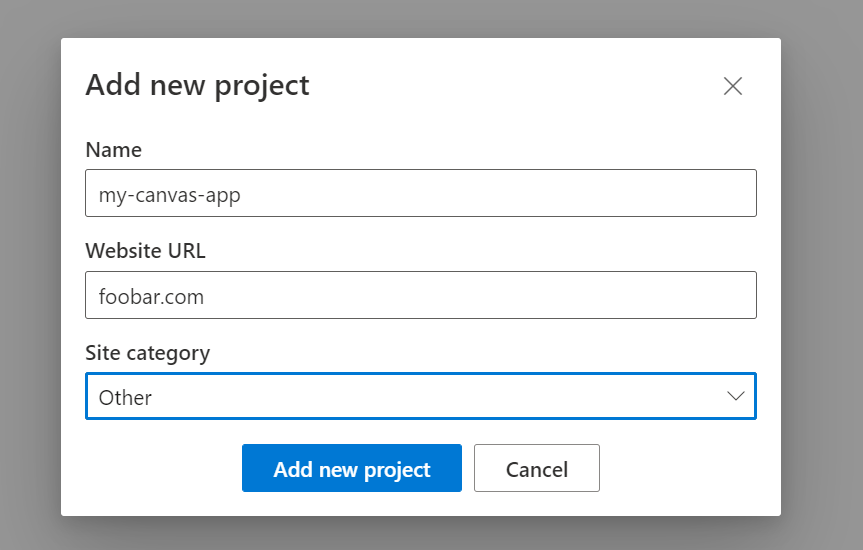
- Sign up for a free Clarity account
- Set up your project
- Use Power Platform CLI to create the code component
- In the scaffolded project, locate
ControlManifest.Input.xmlandindex.ts - Update the
ControlManifest.Input.xmlfile to
<?xml version="1.0" encoding="utf-8" ?>
<manifest>
  <control namespace="ClarityNameSpace" constructor="ClarityCodeSnippet" version="1.0.0" display-name-key="ClarityLovesPowerApps" description-key="Clarity Code Component to analyze user behavior" control-type="standard" >
    <property name="YourClarityProjectID" display-name-key="<your-clarity-project-id>" description-key="description" of-type="SingleLine.Text" usage="bound" required="true" />
    <external-service-usage enabled="false">
    </external-service-usage>
    <resources>
      <code path="index.ts" order="1"/>
    </resources>
  </control>
</manifest>
- In the index.ts file, we first need a
private _Container: HTMLDivElement;above the constructor - then add the following code to the
init method
 public init(context: ComponentFramework.Context<IInputs>, notifyOutputChanged: () => void, state: ComponentFramework.Dictionary, container:HTMLDivElement): void
    {
        const head = document.getElementsByTagName('head')[0];
        const script = document.createElement('script');
        script.innerHTML = '(function(c,l,a,r,i,t,y){c[a]=c[a]||function(){(c[a].q=c[a].q||[]).push(arguments)};t=l.createElement(r);t.async=1;t.src="https://www.clarity.ms/tag/"+i;y=l.getElementsByTagName(r)[0];y.parentNode.insertBefore(t,y);})(window, document, "clarity", "script", "<your clarity project id>");'
        head.insertBefore(script, head.firstChild);
        const textDiv = "<div>We are tracking this app with Microsoft clarity, have a lovely day!</div>"


        this._Container = document.createElement("div");
        this._Container.id = "ClarityDivID";
        this._Container.innerHTML = textDiv;

        container.appendChild(this._Container);
    }
- Packageand Build your component
- Import your code component solution
- Add your code component into a Canvas App
- Don’t forget to (re-) publish your app ;-)
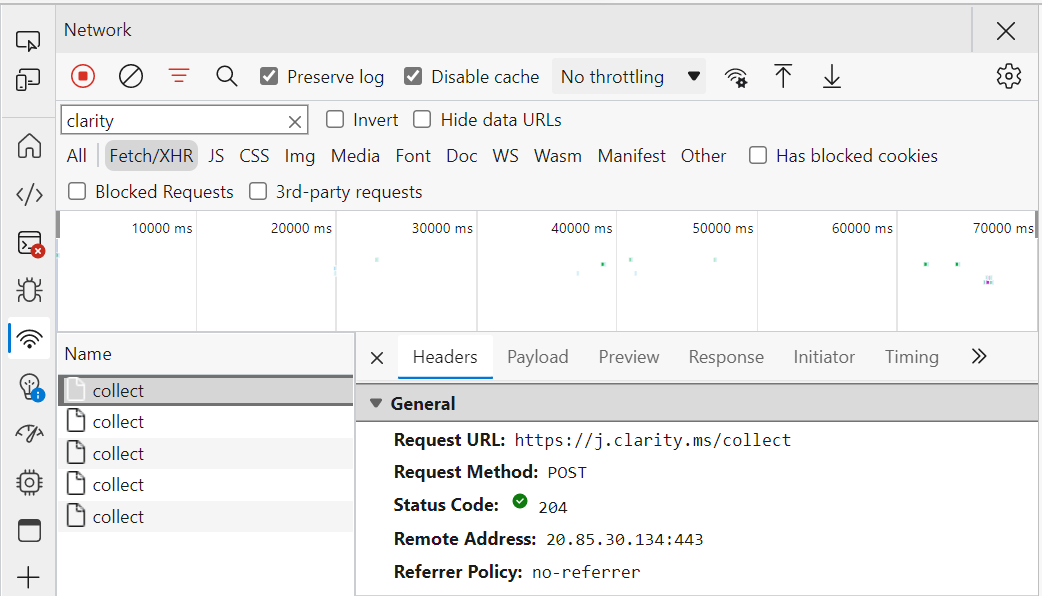
When you now use the app, you can open Edge Dev tools on the Network tab and see the work Clarity is doing:
How does this now look like in our Canvas app?
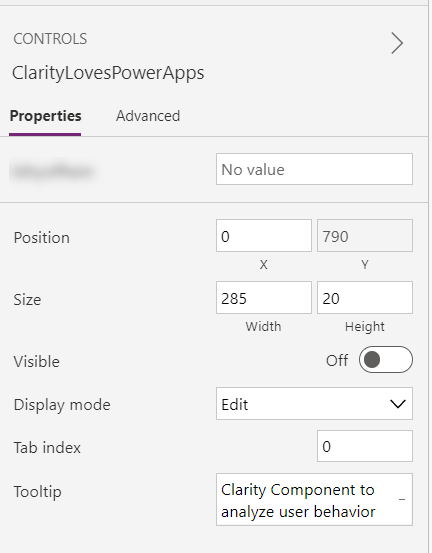
In your Canvas app, you can either style your code component or you can set the Visible property to false to hide it.
It takes a decent while (I guess about 90 minutes) for data to arrive for the first time in Clarity, but after that it runs smoothly - here is how the dashboard then looks like:
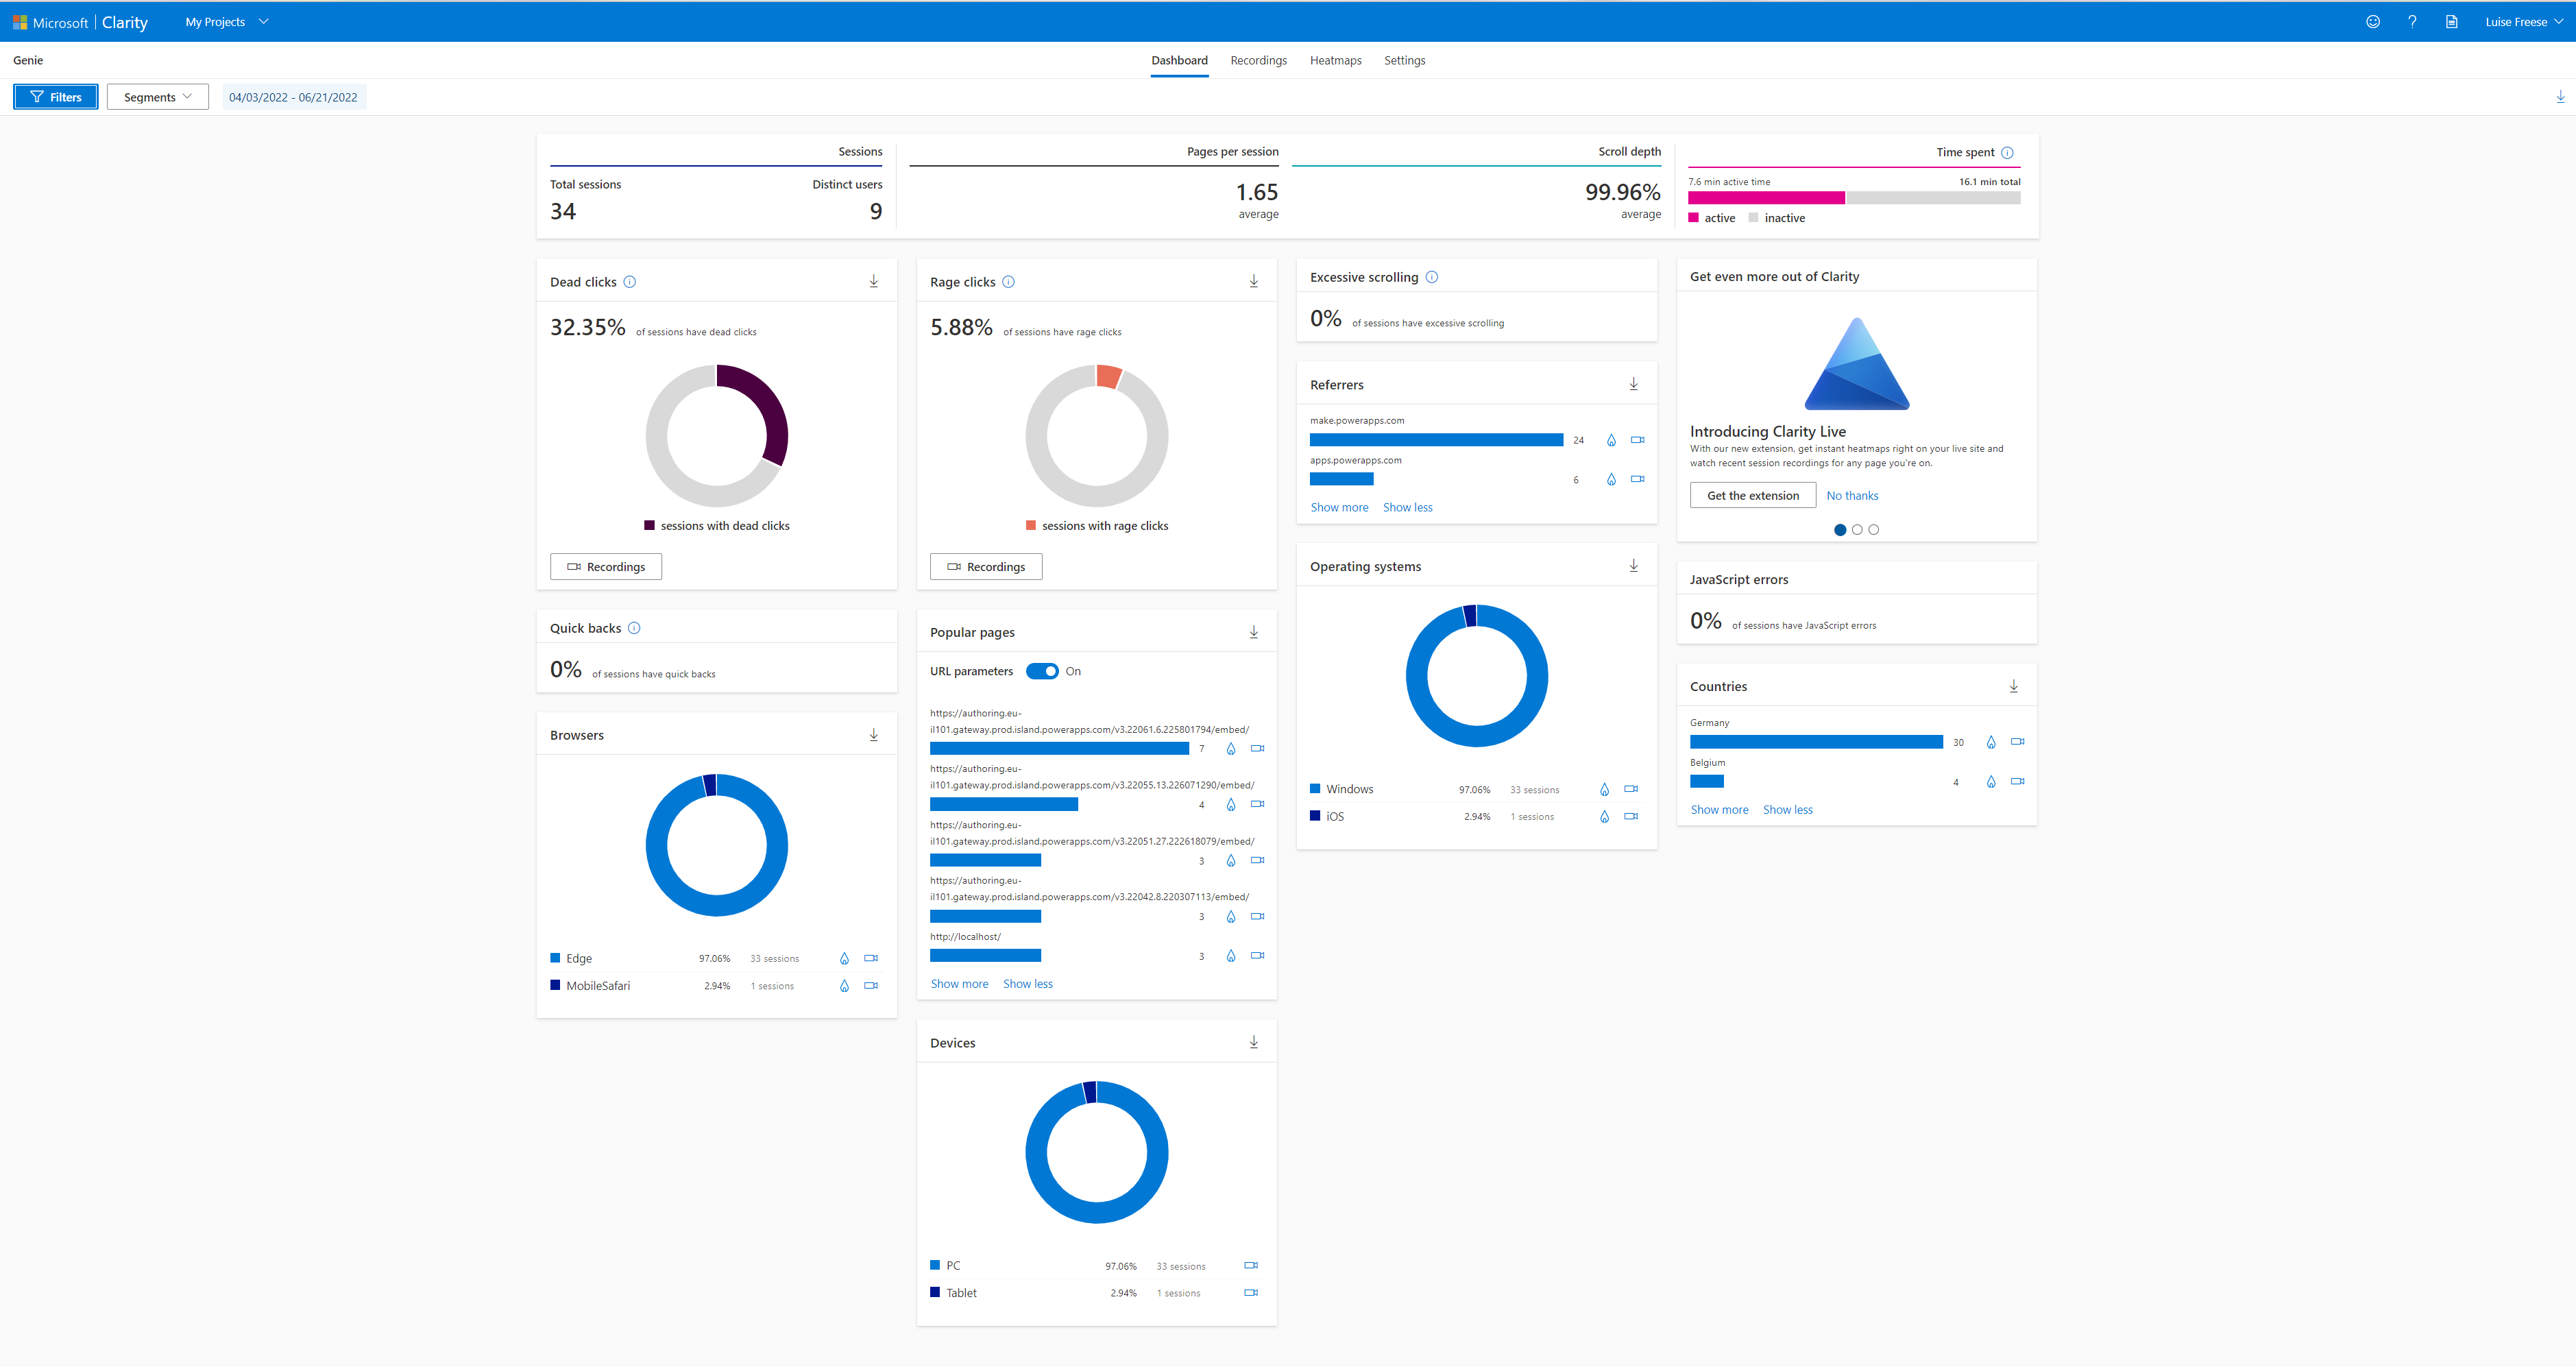
If we now want get more into the details of users are interacting with our apps (sometimes easier than asking them), we can watch a replay of the session recordings:
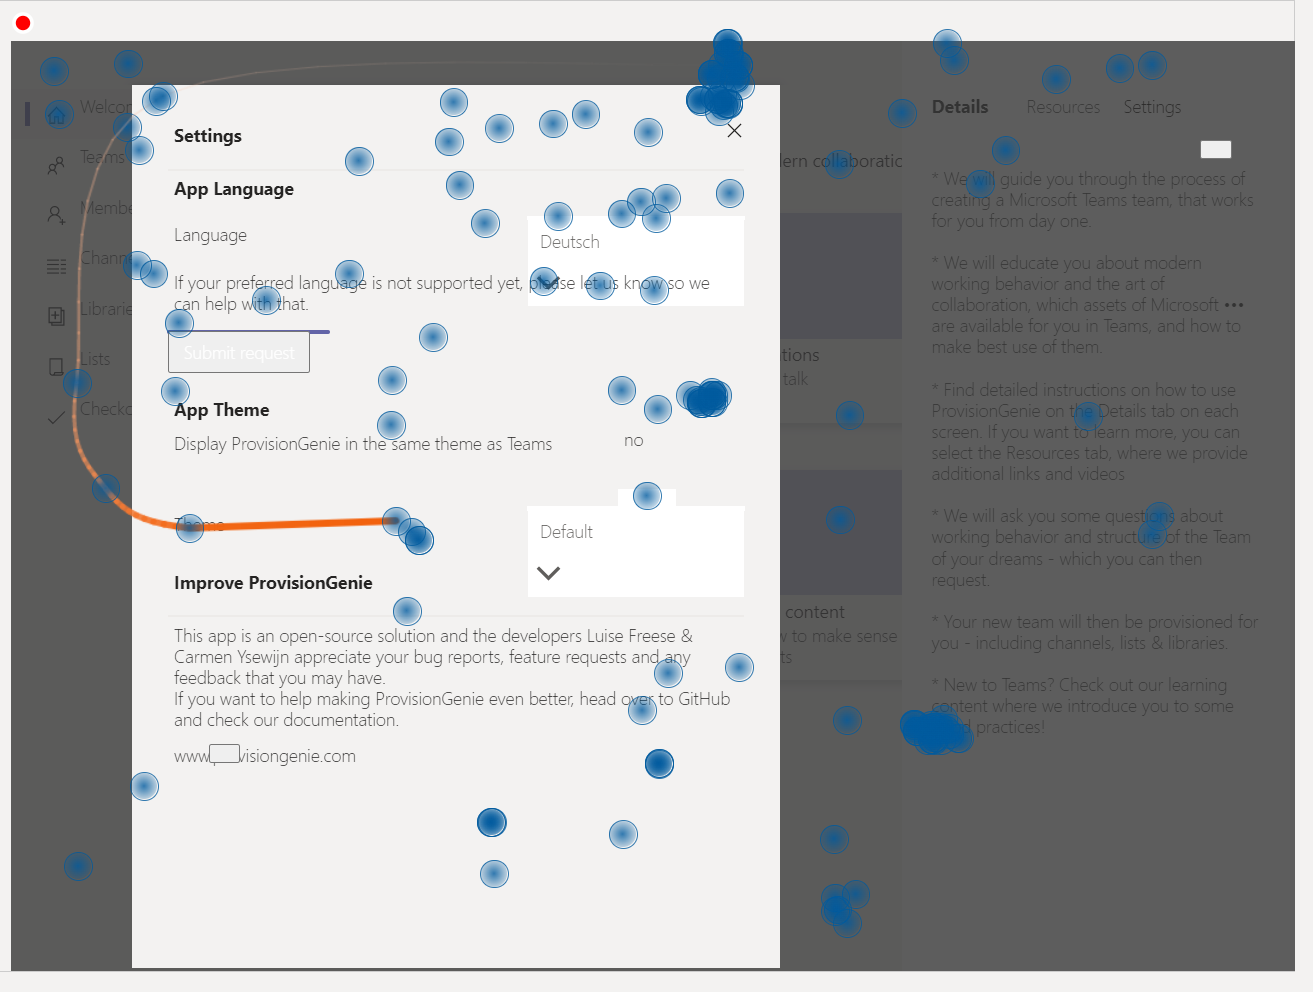
This gives us information on where users click, scroll and type.
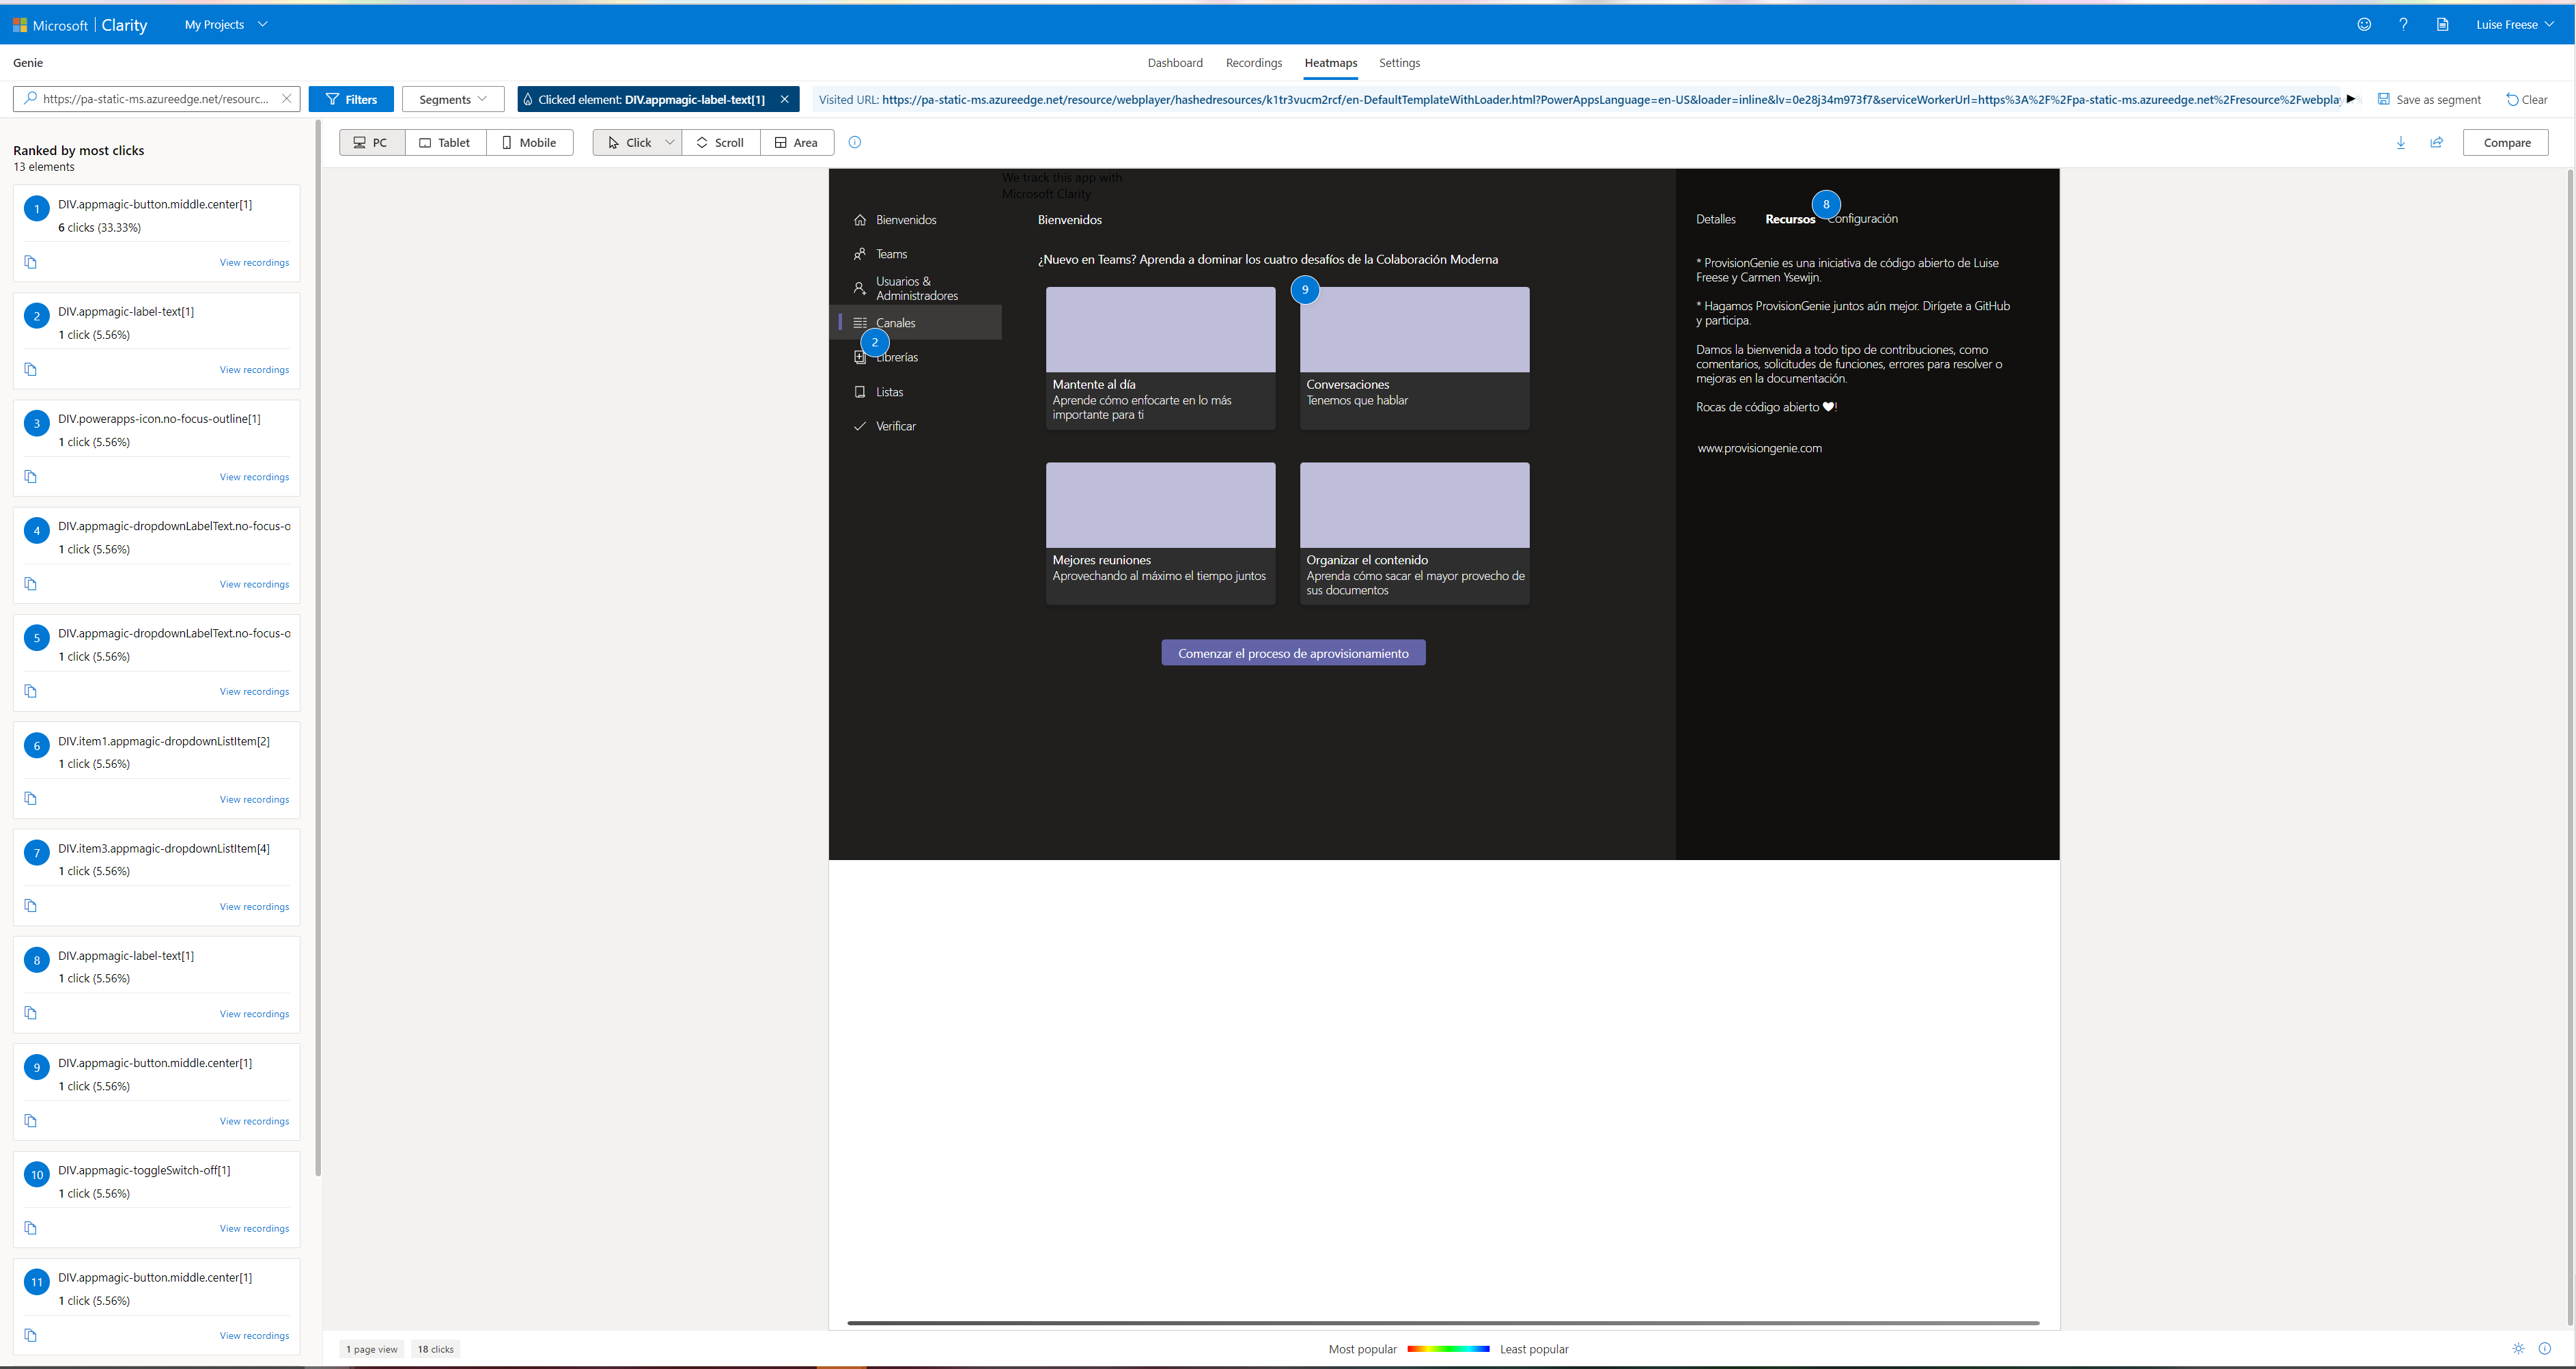
Heatmaps are a valuable feature to determine which parts of an app are most selected:
Where to find the component
You can find this component on my GitHub - Let me know if you have questions! If you found this blog post useful, please also subscribe to my newsletter - news coming about every 2 months, I promise to not spam you!
You May Also Like
How 3 makers, 2 devs and a princess came together to save kittens for a hackathon
How 3 makers, 2 devs and a princess came together to save kittens for a hackathon The Story (Michael) Just before Southcoast Summit 2021 got started, the organizers hosted the Automate Everything - …
How to rename files in SharePoint with Power Automate
the issue Although SharePoint and Power Automate are heavily interwoven, there is no “rename file” action in Power Automate - if the file lives in a SharePoint library. Out of the box that …
how to use oh-my-posh with PnP PowerShell
What is oh my posh? Oh-my-posh is an amazing prompt engine that does not only pretty up the terminal you use, but it will ease your work. By using an established theme or creating a new one, you get …


